Process Flow Diagram (PFD) is a simple form of diagram that uses symbols to identify instruments and vessels and to describe the primary flow path through a process. It illustrates the general process streams, major equipment and key control loops. They also provide detailed mass energy balance data along with major stream composition and physical properties
The process flow diagram (PFD) represents a quantum step up from the BFD in terms of the amount of information that it contains. The PFD contains the bulk of the chemical engineering data necessary for the design of a chemical process. For all of the diagrams discussed in this chapter, there are no universally accepted standards. The PFD from one company will probably contain slightly different information than the PFD for the same process from another company. Having made this point, it is fair to say that most PFDs convey very similar information.
It is clear that the PFD is a complex diagram requiring a substantial effort to prepare. It is essential that it should remain uncluttered and be easy to follow, to avoid errors in presentation and interpretation. Often PFDs are drawn on large sheets of paper, and several connected sheets may be required for a complex process. Because of the page size limitations associated with this text, complete PFDs cannot be presented here. Consequently, certain liberties have been taken in the presentation of the PFDs in this text. Specifically, certain information will be presented in accompanying tables, and only the essential process information will be included on the PFD. The resulting PFDs will retain clarity of presentation, but the reader must refer to the flow summary and equipment summary tables in order to extract all the required information about the process.
Nowadays with the advent of computers and new technology, we tend to use computerized process flow diagrams. In old computer era, we used to draw process flow diagrams with the help of supporting software manually but now we have many process simulators that automatically create process flow diagrams. We can also make use of the Computer Aided Design (CAD) technology or flow chart software to enhance our process flow diagram skills
Information Provided in a Flow Summary:
Stream Number
Temperature (°C)
Pressure (bar)
Vapor Fraction
Total Mass Flow rate (kg/h)
Total Mole Flow rate (kmol/h)
Individual Component Flow rates (kmol/h)
Optional Information>
Component Mole Fractions
Component Mass Fractions
Individual Component Flow rates (kg/h)
Volumetric Flow rates (m3/h)
Significant Physical Properties
Density
Viscosity>
Thermodynamic Data
Heat Capacity
Stream Enthalpy
Stream Name
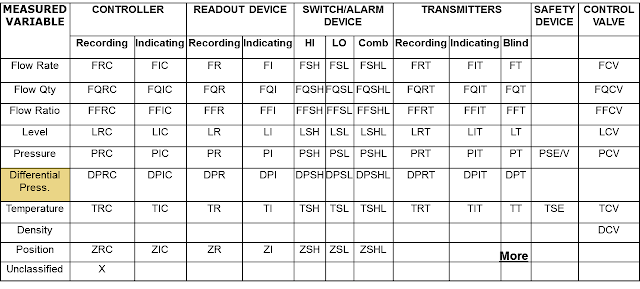
More about P&ID
| PFDs should | PFDs should not |
- Process Piping - major process lines
- Major equipment symbols, names and identification numbers
- Flow directions
- Major bypass and recirculation lines
- Control valves and valves that affect operation of the system
- Control loops that affect operation of
| - Pipe classes or piping line numbers
- Process control instrumentation (sensors and final elements)
- Minor bypass lines
- Isolation and shutoff valves
- Maintenance vents and drains
- Relief and safety valves
- Flanges
|


