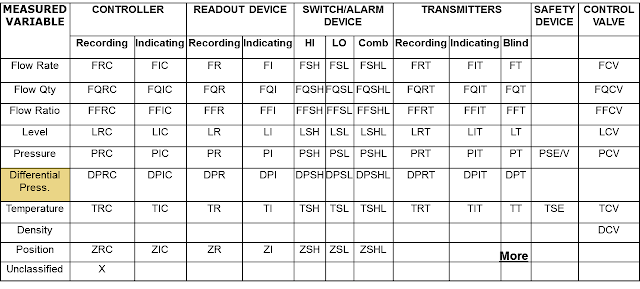
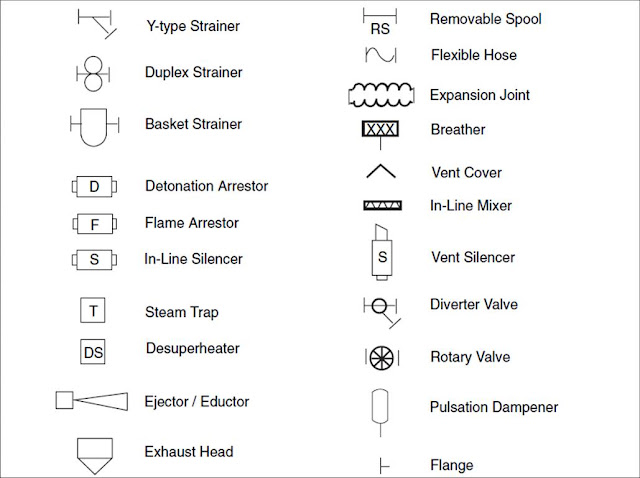
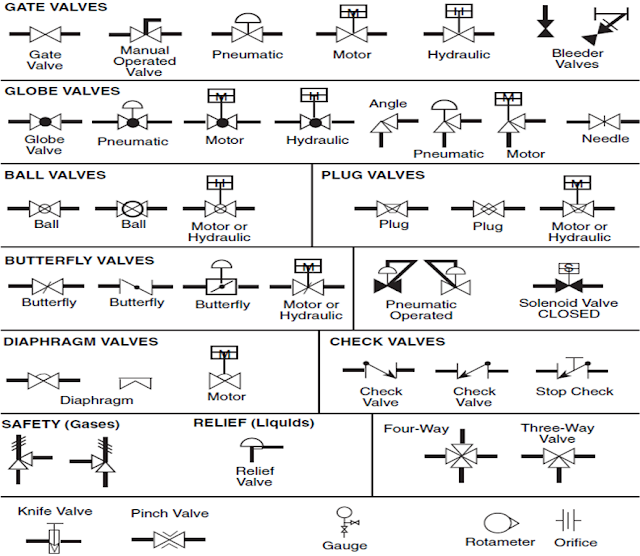
Isometric drawing presents three faces of an object and they all are equally foreshortened. It represents the concept from multiple angle. Professor William Farish (1759–1837) invented the concept 1st. Isometric paper is available to draw isometric.
I always use excel for drawing piping concept to represent any process primarily and it really help me to get rid of using pencil eraser frequently. It also ease the drawing process by allowing copy and paste for same type of object. You can use different color to represent the drawing in your way. Moreover you can add automation by VBA later.
Here I will describe how I draw isometric in excel.
It is very simple you can 1st draw isometric grid in excel by draw border manually and adjusting row height and column width as per your requirement.
Here you can get the sheet with the isometric grid. You can copy it and adjust the height and width if required. It can be copied easily to extent the drawing area. Just select the rows with existing grid, copy and paste to the required empty grid area and follow the same procedure for extending column area.
Click here to download isometric grid and sample drawing
Now you can start your drawing using the drawing tools,shape etc available in excel.
How to change color of open or close position for operating a valve with VBA.
Sub Valve_245()
Dim S As Variant
Dim v As Variant
Dim Obj As Variant


    v = 1 ' Serial no which is maitained in column AE and need change for each sl no
    Set Obj = ActiveSheet.Shapes.Range(Array("Flowchart: Collate 245")) ' slection of the valve having collate 245 and need to change for every valve


    Application.ScreenUpdating = False
    S = ActiveSheet.Cells(v + 1, 33).Value
    If S = 0 Then
    Obj.Select
    With Selection.ShapeRange.Fill
        .Visible = msoTrue
        .ForeColor.RGB = RGB(0, 176, 80)
        .Transparency = 0
        .Solid
    End With
    With Selection.ShapeRange.Line
        .Visible = msoTrue
        .ForeColor.RGB = RGB(0, 176, 80)
        .Transparency = 0
    End With
    ActiveSheet.Cells(v + 1, 33) = 1
    Range("D20").Select
    End If

    If S = 1 Then
    Obj.Select
    With Selection.ShapeRange.Fill
        .Visible = msoTrue
        .ForeColor.ObjectThemeColor = msoThemeColorBackground2
        .ForeColor.TintAndShade = 0
        .ForeColor.Brightness = -0.5
        .Transparency = 0
        .Solid
    End With
     With Selection.ShapeRange.Line
        .Visible = msoTrue
        .ForeColor.ObjectThemeColor = msoThemeColorBackground2
        .ForeColor.TintAndShade = 0
        .ForeColor.Brightness = -0.5
        .Transparency = 0
    End With


    ActiveSheet.Cells(v + 1, 33) = 0
    Range("D20").Select

    End If

    Application.ScreenUpdating = True
End Sub
Sub Valve_244()
Dim S As Variant
Dim v As Variant
Dim Obj As Variant


    v = 2
    Set Obj = ActiveSheet.Shapes.Range(Array("Flowchart: Collate 244"))


    Application.ScreenUpdating = False
    S = ActiveSheet.Cells(v + 1, 33).Value
    If S = 0 Then
    Obj.Select
    With Selection.ShapeRange.Fill
        .Visible = msoTrue
        .ForeColor.RGB = RGB(0, 176, 80)
        .Transparency = 0
        .Solid
    End With
    With Selection.ShapeRange.Line
        .Visible = msoTrue
        .ForeColor.RGB = RGB(0, 176, 80)
        .Transparency = 0
    End With
    ActiveSheet.Cells(v + 1, 33) = 1
    Range("D20").Select
    End If

    If S = 1 Then
    Obj.Select
    With Selection.ShapeRange.Fill
        .Visible = msoTrue
        .ForeColor.ObjectThemeColor = msoThemeColorBackground2
        .ForeColor.TintAndShade = 0
        .ForeColor.Brightness = -0.5
        .Transparency = 0
        .Solid
    End With
     With Selection.ShapeRange.Line
        .Visible = msoTrue
        .ForeColor.ObjectThemeColor = msoThemeColorBackground2
        .ForeColor.TintAndShade = 0
        .ForeColor.Brightness = -0.5
        .Transparency = 0
    End With


    ActiveSheet.Cells(v + 1, 33) = 0
    Range("D20").Select

    End If

    Application.ScreenUpdating = True
End Sub
Sub Valve_235()
Dim S As Variant
Dim v As Variant
Dim Obj As Variant


    v = 3
    Set Obj = ActiveSheet.Shapes.Range(Array("Flowchart: Collate 235"))


    Application.ScreenUpdating = False
    S = ActiveSheet.Cells(v + 1, 33).Value
    If S = 0 Then
    Obj.Select
    With Selection.ShapeRange.Fill
        .Visible = msoTrue
        .ForeColor.RGB = RGB(0, 176, 80)
        .Transparency = 0
        .Solid
    End With
    With Selection.ShapeRange.Line
        .Visible = msoTrue
        .ForeColor.RGB = RGB(0, 176, 80)
        .Transparency = 0
    End With
    ActiveSheet.Cells(v + 1, 33) = 1
    Range("D20").Select
    End If

    If S = 1 Then
    Obj.Select
    With Selection.ShapeRange.Fill
        .Visible = msoTrue
        .ForeColor.ObjectThemeColor = msoThemeColorBackground2
        .ForeColor.TintAndShade = 0
        .ForeColor.Brightness = -0.5
        .Transparency = 0
        .Solid
    End With
     With Selection.ShapeRange.Line
        .Visible = msoTrue
        .ForeColor.ObjectThemeColor = msoThemeColorBackground2
        .ForeColor.TintAndShade = 0
        .ForeColor.Brightness = -0.5
        .Transparency = 0
    End With


    ActiveSheet.Cells(v + 1, 33) = 0
    Range("D20").Select

    End If

    Application.ScreenUpdating = True
End Sub


Sub Pump_221()
Dim S As Variant
Dim v As Variant
Dim Obj As Variant


    v = 4
    Set Obj = ActiveSheet.Shapes.Range(Array("Flowchart: Sequential Access Storage 221"))


    Application.ScreenUpdating = False
    S = ActiveSheet.Cells(v + 1, 33).Value
    If S = 0 Then
    Obj.Select
    With Selection.ShapeRange.Fill
        .Visible = msoTrue
        .ForeColor.RGB = RGB(0, 176, 80)
        .Transparency = 0
        .Solid
    End With
    With Selection.ShapeRange.Line
        .Visible = msoTrue
        .ForeColor.RGB = RGB(0, 176, 80)
        .Transparency = 0
    End With
    ActiveSheet.Cells(v + 1, 33) = 1
    Range("D20").Select
    End If

    If S = 1 Then
    Obj.Select
    With Selection.ShapeRange.Fill
        .Visible = msoTrue
        .ForeColor.ObjectThemeColor = msoThemeColorBackground2
        .ForeColor.TintAndShade = 0
        .ForeColor.Brightness = -0.5
        .Transparency = 0
        .Solid
    End With
     With Selection.ShapeRange.Line
        .Visible = msoTrue
        .ForeColor.ObjectThemeColor = msoThemeColorBackground2
        .ForeColor.TintAndShade = 0
        .ForeColor.Brightness = -0.5
        .Transparency = 0
    End With


    ActiveSheet.Cells(v + 1, 33) = 0
    Range("D20").Select

    End If

    Application.ScreenUpdating = True
End Sub
Sub Pump_194()
Dim S As Variant
Dim v As Variant
Dim Obj As Variant


    v = 5
    Set Obj = ActiveSheet.Shapes.Range(Array("Flowchart: Sequential Access Storage 194"))


    Application.ScreenUpdating = False
    S = ActiveSheet.Cells(v + 1, 33).Value
    If S = 0 Then
    Obj.Select
    With Selection.ShapeRange.Fill
        .Visible = msoTrue
        .ForeColor.RGB = RGB(0, 176, 80)
        .Transparency = 0
        .Solid
    End With
    With Selection.ShapeRange.Line
        .Visible = msoTrue
        .ForeColor.RGB = RGB(0, 176, 80)
        .Transparency = 0
    End With
    ActiveSheet.Cells(v + 1, 33) = 1
    Range("D20").Select
    End If

    If S = 1 Then
    Obj.Select
    With Selection.ShapeRange.Fill
        .Visible = msoTrue
        .ForeColor.ObjectThemeColor = msoThemeColorBackground2
        .ForeColor.TintAndShade = 0
        .ForeColor.Brightness = -0.5
        .Transparency = 0
        .Solid
    End With
     With Selection.ShapeRange.Line
        .Visible = msoTrue
        .ForeColor.ObjectThemeColor = msoThemeColorBackground2
        .ForeColor.TintAndShade = 0
        .ForeColor.Brightness = -0.5
        .Transparency = 0
    End With


    ActiveSheet.Cells(v + 1, 33) = 0
    Range("D20").Select

    End If

    Application.ScreenUpdating = True
End Sub


Sub Valve_139()
Dim S As Variant
Dim v As Variant
Dim Obj As Variant


    v = 6
    Set Obj = ActiveSheet.Shapes.Range(Array("Flowchart: Collate 139"))


    Application.ScreenUpdating = False
    S = ActiveSheet.Cells(v + 1, 33).Value
    If S = 0 Then
    Obj.Select
    With Selection.ShapeRange.Fill
        .Visible = msoTrue
        .ForeColor.RGB = RGB(0, 176, 80)
        .Transparency = 0
        .Solid
    End With
    With Selection.ShapeRange.Line
        .Visible = msoTrue
        .ForeColor.RGB = RGB(0, 176, 80)
        .Transparency = 0
    End With
    ActiveSheet.Cells(v + 1, 33) = 1
    Range("D20").Select
    End If

    If S = 1 Then
    Obj.Select
    With Selection.ShapeRange.Fill
        .Visible = msoTrue
        .ForeColor.ObjectThemeColor = msoThemeColorBackground2
        .ForeColor.TintAndShade = 0
        .ForeColor.Brightness = -0.5
        .Transparency = 0
        .Solid
    End With
     With Selection.ShapeRange.Line
        .Visible = msoTrue
        .ForeColor.ObjectThemeColor = msoThemeColorBackground2
        .ForeColor.TintAndShade = 0
        .ForeColor.Brightness = -0.5
        .Transparency = 0
    End With


    ActiveSheet.Cells(v + 1, 33) = 0
    Range("D20").Select

    End If

    Application.ScreenUpdating = True
End Sub

Sub Valve_333()
Dim S As Variant
Dim v As Variant
Dim Obj As Variant


    v = 7
    Set Obj = ActiveSheet.Shapes.Range(Array("Flowchart: Collate 333"))


    Application.ScreenUpdating = False
    S = ActiveSheet.Cells(v + 1, 33).Value
    If S = 0 Then
    Obj.Select
    With Selection.ShapeRange.Fill
        .Visible = msoTrue
        .ForeColor.RGB = RGB(0, 176, 80)
        .Transparency = 0
        .Solid
    End With
    With Selection.ShapeRange.Line
        .Visible = msoTrue
        .ForeColor.RGB = RGB(0, 176, 80)
        .Transparency = 0
    End With
    ActiveSheet.Cells(v + 1, 33) = 1
    Range("D20").Select
    End If

    If S = 1 Then
    Obj.Select
    With Selection.ShapeRange.Fill
        .Visible = msoTrue
        .ForeColor.ObjectThemeColor = msoThemeColorBackground2
        .ForeColor.TintAndShade = 0
        .ForeColor.Brightness = -0.5
        .Transparency = 0
        .Solid
    End With
     With Selection.ShapeRange.Line
        .Visible = msoTrue
        .ForeColor.ObjectThemeColor = msoThemeColorBackground2
        .ForeColor.TintAndShade = 0
        .ForeColor.Brightness = -0.5
        .Transparency = 0
    End With


    ActiveSheet.Cells(v + 1, 33) = 0
    Range("D20").Select

    End If

    Application.ScreenUpdating = True
End Sub


Sub Valve_159()
Dim S As Variant
Dim v As Variant
Dim Obj As Variant


    v = 8
    Set Obj = ActiveSheet.Shapes.Range(Array("Flowchart: Collate 159"))


    Application.ScreenUpdating = False
    S = ActiveSheet.Cells(v + 1, 33).Value
    If S = 0 Then
    Obj.Select
    With Selection.ShapeRange.Fill
        .Visible = msoTrue
        .ForeColor.RGB = RGB(0, 176, 80)
        .Transparency = 0
        .Solid
    End With
    With Selection.ShapeRange.Line
        .Visible = msoTrue
        .ForeColor.RGB = RGB(0, 176, 80)
        .Transparency = 0
    End With
    ActiveSheet.Cells(v + 1, 33) = 1
    Range("D20").Select
    End If

    If S = 1 Then
    Obj.Select
    With Selection.ShapeRange.Fill
        .Visible = msoTrue
        .ForeColor.ObjectThemeColor = msoThemeColorBackground2
        .ForeColor.TintAndShade = 0
        .ForeColor.Brightness = -0.5
        .Transparency = 0
        .Solid
    End With
     With Selection.ShapeRange.Line
        .Visible = msoTrue
        .ForeColor.ObjectThemeColor = msoThemeColorBackground2
        .ForeColor.TintAndShade = 0
        .ForeColor.Brightness = -0.5
        .Transparency = 0
    End With


    ActiveSheet.Cells(v + 1, 33) = 0
    Range("D20").Select

    End If

    Application.ScreenUpdating = True
End Sub

Sub Valve_94()
Dim S As Variant
Dim v As Variant
Dim Obj As Variant


    v = 9
    Set Obj = ActiveSheet.Shapes.Range(Array("Flowchart: Collate 94"))


    Application.ScreenUpdating = False
    S = ActiveSheet.Cells(v + 1, 33).Value
    If S = 0 Then
    Obj.Select
    With Selection.ShapeRange.Fill
        .Visible = msoTrue
        .ForeColor.RGB = RGB(0, 176, 80)
        .Transparency = 0
        .Solid
    End With
    With Selection.ShapeRange.Line
        .Visible = msoTrue
        .ForeColor.RGB = RGB(0, 176, 80)
        .Transparency = 0
    End With
    ActiveSheet.Cells(v + 1, 33) = 1
    Range("D20").Select
    End If

    If S = 1 Then
    Obj.Select
    With Selection.ShapeRange.Fill
        .Visible = msoTrue
        .ForeColor.ObjectThemeColor = msoThemeColorBackground2
        .ForeColor.TintAndShade = 0
        .ForeColor.Brightness = -0.5
        .Transparency = 0
        .Solid
    End With
     With Selection.ShapeRange.Line
        .Visible = msoTrue
        .ForeColor.ObjectThemeColor = msoThemeColorBackground2
        .ForeColor.TintAndShade = 0
        .ForeColor.Brightness = -0.5
        .Transparency = 0
    End With


    ActiveSheet.Cells(v + 1, 33) = 0
    Range("D20").Select

    End If

    Application.ScreenUpdating = True
End Sub

Sub Valve_82()
Dim S As Variant
Dim v As Variant
Dim Obj As Variant


    v = 10
    Set Obj = ActiveSheet.Shapes.Range(Array("Flowchart: Collate 82"))


    Application.ScreenUpdating = False
    S = ActiveSheet.Cells(v + 1, 33).Value
    If S = 0 Then
    Obj.Select
    With Selection.ShapeRange.Fill
        .Visible = msoTrue
        .ForeColor.RGB = RGB(0, 176, 80)
        .Transparency = 0
        .Solid
    End With
    With Selection.ShapeRange.Line
        .Visible = msoTrue
        .ForeColor.RGB = RGB(0, 176, 80)
        .Transparency = 0
    End With
    ActiveSheet.Cells(v + 1, 33) = 1
    Range("D20").Select
    End If

    If S = 1 Then
    Obj.Select
    With Selection.ShapeRange.Fill
        .Visible = msoTrue
        .ForeColor.ObjectThemeColor = msoThemeColorBackground2
        .ForeColor.TintAndShade = 0
        .ForeColor.Brightness = -0.5
        .Transparency = 0
        .Solid
    End With
     With Selection.ShapeRange.Line
        .Visible = msoTrue
        .ForeColor.ObjectThemeColor = msoThemeColorBackground2
        .ForeColor.TintAndShade = 0
        .ForeColor.Brightness = -0.5
        .Transparency = 0
    End With


    ActiveSheet.Cells(v + 1, 33) = 0
    Range("D20").Select

    End If

    Application.ScreenUpdating = True
End Sub

Sub Valve_87()
Dim S As Variant
Dim v As Variant
Dim Obj As Variant


    v = 11
    Set Obj = ActiveSheet.Shapes.Range(Array("Flowchart: Collate 87"))


    Application.ScreenUpdating = False
    S = ActiveSheet.Cells(v + 1, 33).Value
    If S = 0 Then
    Obj.Select
    With Selection.ShapeRange.Fill
        .Visible = msoTrue
        .ForeColor.RGB = RGB(0, 176, 80)
        .Transparency = 0
        .Solid
    End With
    With Selection.ShapeRange.Line
        .Visible = msoTrue
        .ForeColor.RGB = RGB(0, 176, 80)
        .Transparency = 0
    End With
    ActiveSheet.Cells(v + 1, 33) = 1
    Range("D20").Select
    End If

    If S = 1 Then
    Obj.Select
    With Selection.ShapeRange.Fill
        .Visible = msoTrue
        .ForeColor.ObjectThemeColor = msoThemeColorBackground2
        .ForeColor.TintAndShade = 0
        .ForeColor.Brightness = -0.5
        .Transparency = 0
        .Solid
    End With
     With Selection.ShapeRange.Line
        .Visible = msoTrue
        .ForeColor.ObjectThemeColor = msoThemeColorBackground2
        .ForeColor.TintAndShade = 0
        .ForeColor.Brightness = -0.5
        .Transparency = 0
    End With


    ActiveSheet.Cells(v + 1, 33) = 0
    Range("D20").Select

    End If

    Application.ScreenUpdating = True
End Sub

Sub Valve_11()
Dim S As Variant
Dim v As Variant
Dim Obj As Variant


    v = 12
    Set Obj = ActiveSheet.Shapes.Range(Array("Flowchart: Collate 11"))


    Application.ScreenUpdating = False
    S = ActiveSheet.Cells(v + 1, 33).Value
    If S = 0 Then
    Obj.Select
    With Selection.ShapeRange.Fill
        .Visible = msoTrue
        .ForeColor.RGB = RGB(0, 176, 80)
        .Transparency = 0
        .Solid
    End With
    With Selection.ShapeRange.Line
        .Visible = msoTrue
        .ForeColor.RGB = RGB(0, 176, 80)
        .Transparency = 0
    End With
    ActiveSheet.Cells(v + 1, 33) = 1
    Range("D20").Select
    End If

    If S = 1 Then
    Obj.Select
    With Selection.ShapeRange.Fill
        .Visible = msoTrue
        .ForeColor.ObjectThemeColor = msoThemeColorBackground2
        .ForeColor.TintAndShade = 0
        .ForeColor.Brightness = -0.5
        .Transparency = 0
        .Solid
    End With
     With Selection.ShapeRange.Line
        .Visible = msoTrue
        .ForeColor.ObjectThemeColor = msoThemeColorBackground2
        .ForeColor.TintAndShade = 0
        .ForeColor.Brightness = -0.5
        .Transparency = 0
    End With


    ActiveSheet.Cells(v + 1, 33) = 0
    Range("D20").Select

    End If

    Application.ScreenUpdating = True
End Sub

Sub Valve_26()
Dim S As Variant
Dim v As Variant
Dim Obj As Variant


    v = 13
    Set Obj = ActiveSheet.Shapes.Range(Array("Flowchart: Collate 26"))


    Application.ScreenUpdating = False
    S = ActiveSheet.Cells(v + 1, 33).Value
    If S = 0 Then
    Obj.Select
    With Selection.ShapeRange.Fill
        .Visible = msoTrue
        .ForeColor.RGB = RGB(0, 176, 80)
        .Transparency = 0
        .Solid
    End With
    With Selection.ShapeRange.Line
        .Visible = msoTrue
        .ForeColor.RGB = RGB(0, 176, 80)
        .Transparency = 0
    End With
    ActiveSheet.Cells(v + 1, 33) = 1
    Range("D20").Select
    End If

    If S = 1 Then
    Obj.Select
    With Selection.ShapeRange.Fill
        .Visible = msoTrue
        .ForeColor.ObjectThemeColor = msoThemeColorBackground2
        .ForeColor.TintAndShade = 0
        .ForeColor.Brightness = -0.5
        .Transparency = 0
        .Solid
    End With
     With Selection.ShapeRange.Line
        .Visible = msoTrue
        .ForeColor.ObjectThemeColor = msoThemeColorBackground2
        .ForeColor.TintAndShade = 0
        .ForeColor.Brightness = -0.5
        .Transparency = 0
    End With


    ActiveSheet.Cells(v + 1, 33) = 0
    Range("D20").Select

    End If

    Application.ScreenUpdating = True
End Sub


